Overview
You want your structured or non-structured data converted into insights Information?
Our Data Insights tool bring you the state of the art web based system to create and organize your data into Interactive Graph Dashboards, KPIs and user friendly analytical reports which works seamlessly beautiful in any device.
Self Service BI
You can easily create ‘Analytic Models’ based on your data sources or your SQL query results on existing data sources, that are ready for analysis, reporting and dashboard usage by all authorized users. You will be able to do deep analytics of your data without third-party analytic software with drill-downs, drill-throughs, slicers, and other analytic features. Learn more…
Dashboards & KPIs
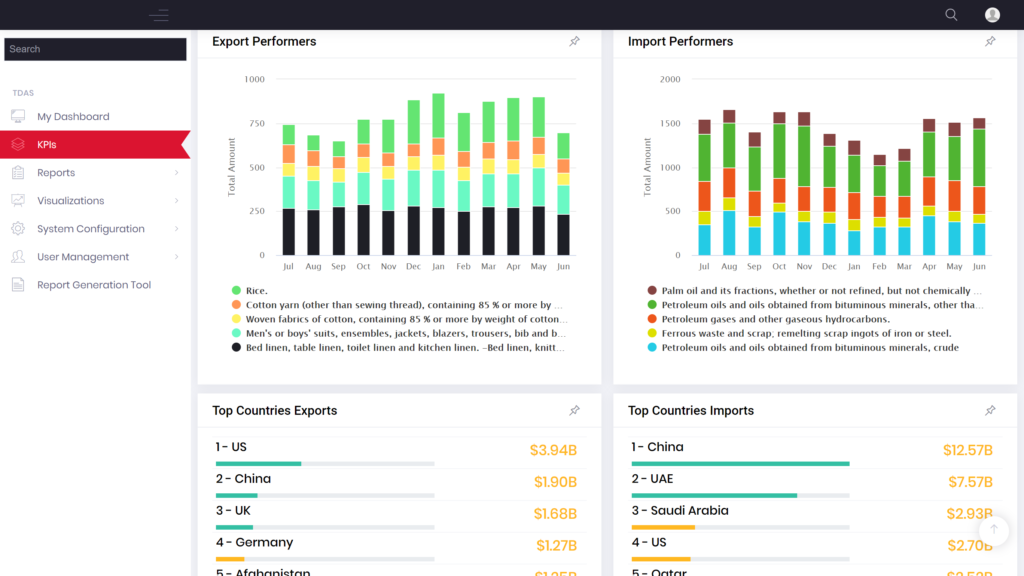
User can use data from MySQL, MS SQL databases or CSV files to easily design and present most valuable information into Interactive graphs, KPI, Scorecards, and Gauges present visual success metric tools, data visualizations, and trend indicators. Learn more…
Our Data Insights tool is a web-based application which is accessible via any web browser in intranet or internet. Any user with little bit technical knowledge can setup connection to existing data sources like MS Excel, MySQL or MSSQL and can do data cleansing first and then analytics and data visualizations.
All created Insights data content is secured by role-based permission. It has all set of BI tool and analytic features which are used to create data insights and dashboards using graph, charts and metric visualizations that are interactive and comprehensive.
Analytic Features
Dashboard Features
- Self-Service Analysis & Reports
- Simple Drag-and-Drop Approach
- Analytic Report – Export to PDF/Excel files
- Share Analytic Reports with Authorized Users
- Analytic Analysis on the Dashboards
- Analytic Analysis on Tablets and Mobile Devices
- Analytic Report team Collaboration
- Simple and customized Dashboard creation
- Use your SQL/ODBC/CSV data sources
- Dashboard Analytic Features
- PIN Favorite or important graphs to your main dashboard
- Share Dashboards with Authorized Users
- KPI and Scorecard Features
- Dashboards on Tablets and Mobile Devices
- Our tool is Web based tool which can be installed on Windows and Linux or any other operating system
- It can install on premise or Cloud based environment
- Responsive – Works on Desktop and mobile devices
- Users can access it from Intranet or Internet, depending on environment configuration
- It has secure user role-based system
- Can connect with structured and non-structured databases
- Data extraction can also be done with simple query
- User can perform data cleansing with easy to use interface
- User can make their own analytics model
- User can create interactive visualizations using graphs
- Customized Dashboards
- Drag and Drop and PIN favorite or important features to graphs
- Drag and Drop and PIN favorite or important features to graphs
- Export/Print Reports to Excel, PDF


